Did you know that National Jelly Bean Day is observed every year on April 22nd? Sounds like a great day for jelly bean math lessons!
Until a few years ago, I didn’t see the value in jelly bean math activities, especially in the upper elementary classroom. Sure, sorting jelly beans and graphing them by color is fun, but who has time for “fun” holiday activities when you have a rigorous curriculum to teach?
But that was before I realized that you can do a whole lot more with jelly beans than just graph them! In fact, you can turn a fun candy-themed lesson into a powerful learning activity by sneaking in some challenging academic content!
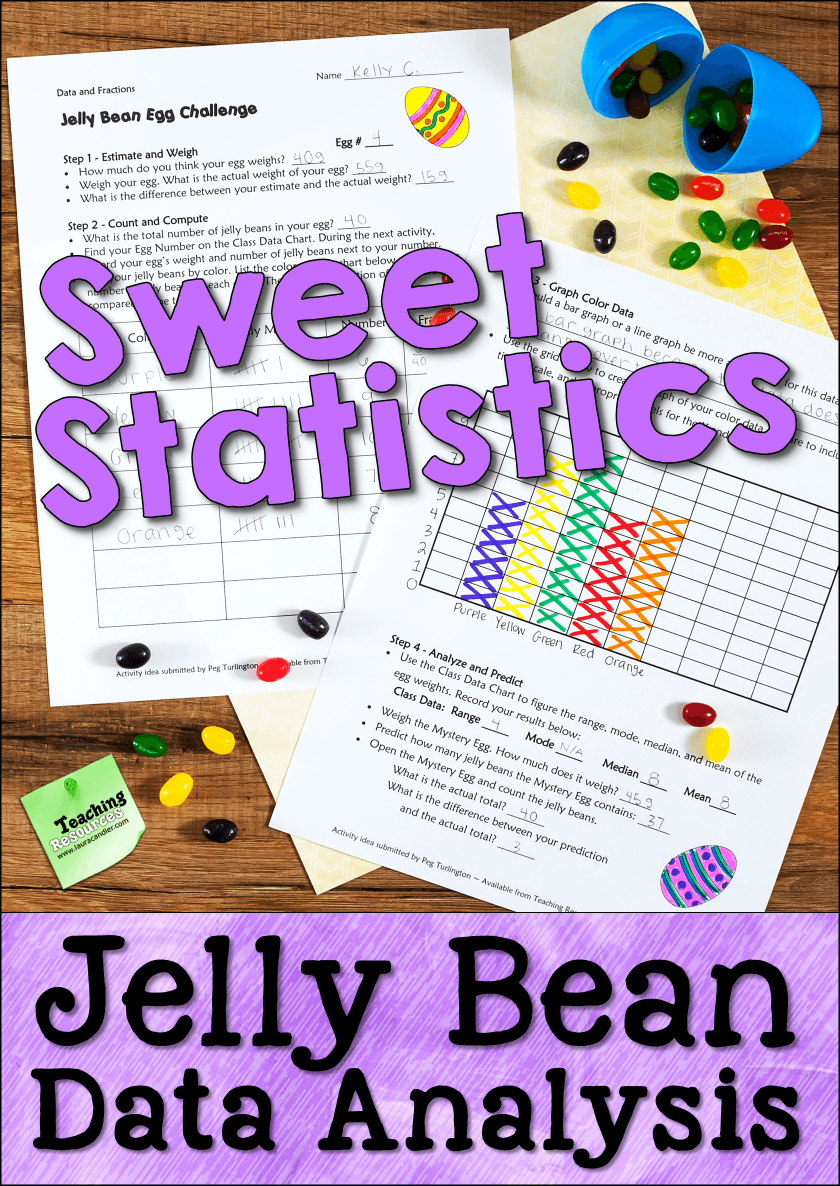
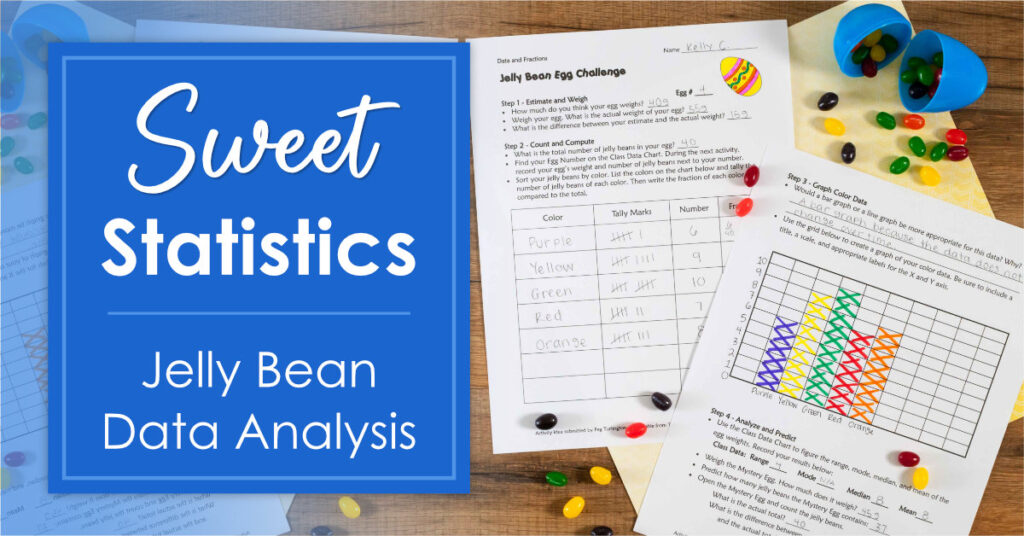
Jelly Bean Egg Challenge
One of my favorite activities is the Jelly Bean Egg Challenge, a sweet statistics lesson that requires students to measure, estimate, collect, compile, and graph jelly bean data in order to analyze it and draw conclusions. That’s a lot of math!
In a nutshell, you secretly fill plastic eggs with different numbers of jelly beans prior to the lesson. Your students will weigh their eggs, then count the jelly beans inside. Then they will try to predict the number of jelly beans inside a “mystery egg” based on its weight.
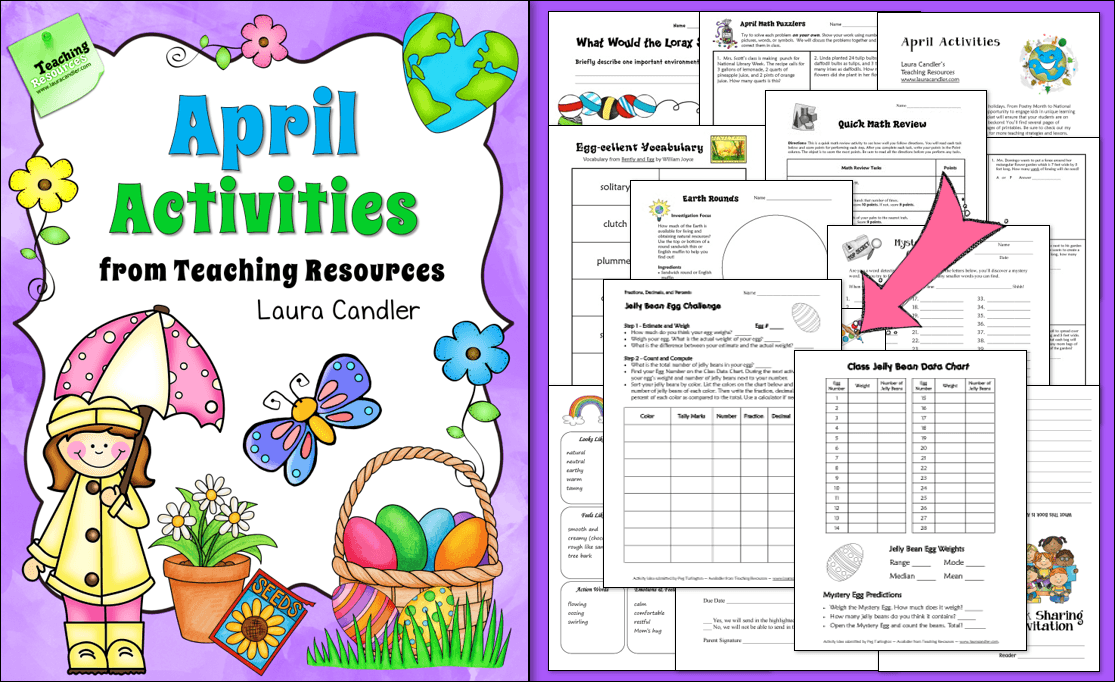
If you’d like to try this activity with your students, you can find step by step directions, ready-to-use printables, and a class data chart in my April Activities for Upper Elementary pack.
More Jelly Bean Data Analysis Ideas
The fun doesn’t have to end there. If you want to dig deeper into Jelly Bean Data Analysis, try any or all of these lesson extension ideas.
- Explore Fractions, Decimals, and Percents After having your students sort and count jelly beans by color, ask them to represent the number of each color as a fractional part of the total. If appropriate, have them convert those fractions to decimals and percents.
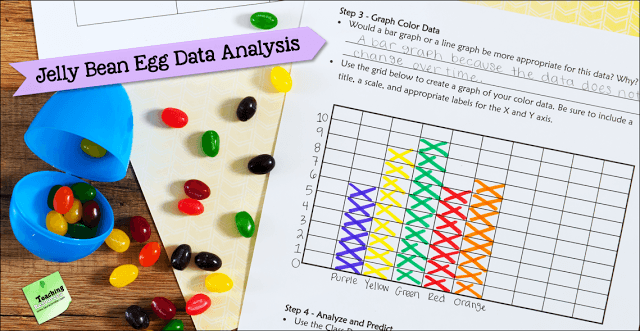
- Introduce Graphing Concepts Use the jelly bean color data to introduce basic graphing concepts and have students create their own graphs on blank graph paper or a blank grid. Discuss questions like these: Which type of graph would be best for this type of data, a line graph or a bar graph? Why? What increment size should be used? What labels should go on the horizontal and vertical axes?
- Create Spreadsheet Graphs Demonstrate how to enter individual jelly bean color data into a spreadsheet and choose the appropriate type of graph from the given options.
- Measure and Compile Data Have kids measure the circumference of the plastic eggs and weigh them before removing the jelly beans. Create a class data chart showing the egg weights and numbers of jelly beans inside each one. Estimate and predict the number of jelly beans inside a sealed egg based on its weight. Predict the number of jelly beans in a sealed egg based on it’s weight.
- Analyze Class Data After the class data is compiled, have students determine the range, mode, median, and mean weight and numbers of jelly beans inside each egg.
Jelly Bean Egg Challenge is a great lesson for the week before Easter, and it’s also a terrific way to celebrate National Jelly Bean Day on April 22nd. What’s the sweetest part of the lesson? Eating the jelly beans at the end, of course! Enjoy!